

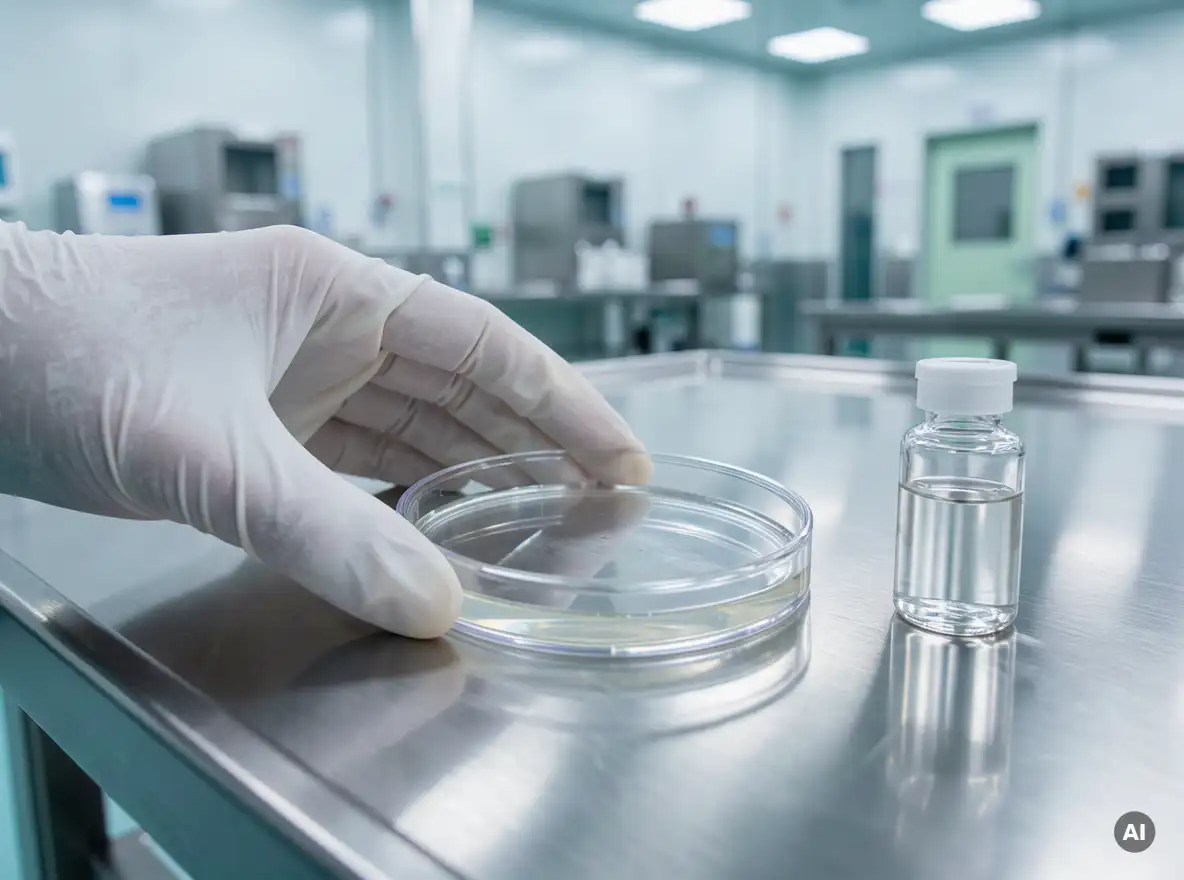
Bioburden testing measures the number of viable microorganisms on or in a specific product, component, or material, while environmental monitoring measures microbial and particulate contamination in the manufacturing environment itself. One program assesses the thing being made; the other assesses the space and surfaces around it. Together they give pharma contamination control teams a more complete picture of where microbial risk originates. The sections below explain how each program works, how they differ in practice, and how their data fit together.
What does each testing program actually measure?
Bioburden testing quantifies the population of viable microorganisms present on a product, raw material, component, or packaging item, typically before sterilization. Environmental monitoring (EM) assesses the microbial and particulate state of cleanrooms and controlled areas, including air, surfaces, equipment, and personnel. The first characterizes the product; the second characterizes the environment.
Bioburden results are usually expressed as colony-forming units (CFU) per item, per gram, or per milliliter. The figure matters because sterilization processes are validated against an assumed starting microbial load, and the bioburden count helps confirm whether that assumption holds. Many programs also identify the organisms recovered, since a spore-forming species poses a different sterilization challenge than a common skin organism.
Environmental monitoring covers a broader range of parameters:
- Viable air sampling: microorganisms carried in cleanroom air, collected with active air samplers (which draw a measured volume of air onto agar) and settle plates (which passively capture particles that deposit over a defined exposure time). The two methods are complementary rather than interchangeable.
- Surface sampling: contact plates and swabs from floors, walls, equipment, and work surfaces
- Personnel monitoring: gloves, gowns, and fingertips of operators
- Non-viable particle counts: airborne particulates measured against cleanroom classification limits
The distinction between living and non-living contamination is explored further in this guide to viable and non-viable particle monitoring.
How do sampling methods and frequency differ?
Bioburden sampling is product-driven and typically batch-related or tied to validation, while environmental monitoring is location-driven and runs on a routine, risk-based schedule. Bioburden tests pull samples from product lots or components; EM tests rotate through defined sampling sites in classified areas.
Bioburden sampling
Bioburden methods depend on the material. Common approaches include membrane filtration for liquids, direct plating, and extraction techniques such as rinsing or sonication for devices and components. The method must be validated, including a recovery efficiency study showing that organisms can actually be removed from the product and counted. Frequency is usually set by the product’s risk profile, the stage of manufacture, and the sterilization process it feeds.
Environmental monitoring sampling
EM programs rely on settle plates, active air samplers, contact plates, swabs, and particle counters. Sampling locations are chosen through a documented risk assessment that considers proximity to open product, personnel traffic, and historical trends. Frequency scales with the grade of the area. In sterile manufacturing under EU GMP, higher-grade zones such as Grade A and B areas are monitored far more intensively than Grade C and D spaces, and Annex 1 expects continuous particle monitoring in Grade A during operation. For a clear explanation of how those grades differ, see this comparison of Grade A and Grade B cleanroom environments.
Which regulations and standards apply to each?
Bioburden testing is governed mainly by sterilization and pharmacopeial standards, while environmental monitoring is driven by GMP regulations and cleanroom standards. Which documents apply depends on the product type, the jurisdiction, and whether the facility manufactures sterile products.
For bioburden, relevant references commonly include the ISO 11737 series for the determination of bioburden and tests of sterility on medical devices, along with pharmacopeial chapters on microbial enumeration and sterility. Sterilization validation standards also depend on a well-characterized bioburden.
For environmental monitoring, the main frameworks are:
- EU GMP Annex 1: specific to the manufacture of sterile medicinal products, setting expectations for EM, alert and action limits, and a documented contamination control strategy
- FDA aseptic processing guidance: expectations for monitoring in aseptic manufacturing in the United States
- ISO 14644: the cleanroom standards series. ISO 14644-1 covers classification of air cleanliness by particle concentration, while ISO 14644-2 covers monitoring and periodic testing to demonstrate continued compliance. ISO classes are separate from, and not automatically interchangeable with, the EU GMP Grades A to D.
Annex 1 applies specifically to sterile medicinal product manufacture, so facilities producing non-sterile products should check which guidance is relevant to them. Annex 1 also expects EM to sit inside a broader plan, as described in this overview of a contamination control strategy under EU GMP Annex 1.
How do bioburden and environmental monitoring data work together?
Bioburden and environmental monitoring data work together by linking cause and effect. EM identifies contamination in the surroundings, and bioburden shows whether that contamination reaches the product. Reviewing both datasets side by side lets quality teams trace a microbial excursion back to its likely source rather than treating each result in isolation.
In practice, the connection runs in several directions:
- Trend correlation: a rise in surface counts near a filling line may precede an increase in product bioburden, flagging a developing problem early.
- Organism identification: if the same species appears in an EM sample and in a bioburden result, that match points toward a possible contamination pathway, which should then be confirmed by investigation.
- Investigation support: during an out-of-limit event, EM records help determine whether the root cause was environmental, personnel-related, or material-related.
- Sterilization assurance: stable bioburden data support the validity of sterilization cycles, while EM confirms that conditions upstream remain controlled.
Neither program substitutes for the other. A clean environment does not guarantee low product bioburden if incoming materials are the source, and low bioburden does not excuse a deteriorating environmental trend. The distinction between contamination in general and the way it spreads is covered in this explanation of contamination versus cross-contamination in pharma.
What role does floor-level contamination control play in both?
Floors are a major pathway for contamination into controlled areas because footwear and wheels carry particles and microorganisms across every threshold. Reducing what enters at floor level lowers the load that EM must detect and that product surfaces may eventually encounter. It is one preventive layer, and it complements, rather than replaces, monitoring.
Dycem states that around 80% of contaminants entering controlled environments do so at floor level, which is why entry points such as gowning rooms, airlocks, and cleanroom corridors deserve attention in any pharma contamination plan. Fewer particles tracked inward can mean fewer environmental excursions to investigate and a steadier baseline in EM trending.
For pedestrian and light-wheeled traffic at these transitions, Dycem CleanZone provides reusable polymeric flooring designed to capture and retain contaminants from shoes and wheels. Dycem reports that its mats capture up to 99.9% of particles under its own test conditions; results in a given facility will depend on traffic, cleaning routines, and how the mats are maintained. The Biomaster silver-ion technology in the mats is designed to inhibit microbial growth on the mat surface. These are product-level properties that support, but do not substitute for, validated cleaning and disinfection, gowning procedures, HVAC and filtration performance, or environmental monitoring itself.
Facilities considering this layer can find sector-specific information on the pharmaceutical industry page.
Choosing the right approach for your facility
Bioburden testing and environmental monitoring answer different questions: one asks how contaminated the product is, the other asks how contaminated the environment is. Strong pharma contamination control depends on running both, interpreting them together, and reducing contamination sources before they register in either dataset. Floor-level controls at entry points are a practical way to do that.
If you are reviewing contamination risks at your entry points, Dycem offers a complimentary site survey to assess traffic flow and identify where floor-level control could support your existing monitoring program.
Frequently Asked Questions
What should I do if bioburden counts suddenly rise but environmental monitoring results are within limits?
Do not assume the environment is clear of fault just because EM results are in range. Investigate other likely sources first, such as incoming raw materials, components, packaging, water systems, hold times, and handling by personnel. Identify the organisms recovered from the product and compare them against your EM isolate library, and also review whether your EM sampling locations actually cover the area where the product is exposed.
Is it worth identifying microorganisms to species level, or are CFU counts enough?
Counts alone show how much contamination is present, but identification shows what it is and where it likely came from. Species-level identification helps you match organisms found in EM samples with those found on product, distinguish skin flora from spore-formers or environmental organisms, and focus an investigation on the right pathway. Many facilities identify all isolates from Grade A and B areas and any excursions above action limits.
What are common mistakes when interpreting bioburden and EM data together?
A frequent mistake is reviewing the two datasets in separate silos, so correlations between rising surface counts and product bioburden go unnoticed. Others include relying only on action-limit breaches rather than trends, failing to validate recovery efficiency for bioburden methods, and treating ISO 14644 classes as interchangeable with EU GMP grades. Combining both datasets in periodic trend reviews, with organism identification, helps avoid these pitfalls.